
What is happening?
Shopify, Meta, Google, GA4 and your sheets joined into one set of numbers the whole team agrees on.
For Shopify D2C brands in India
One trusted view of sales, ad spend, stock and margin, and the workflows that act on what it shows. Built by an operator who has run these numbers from inside a D2C brand.
The demo runs on invented data for a fictional apparel label. No login, nothing to install.
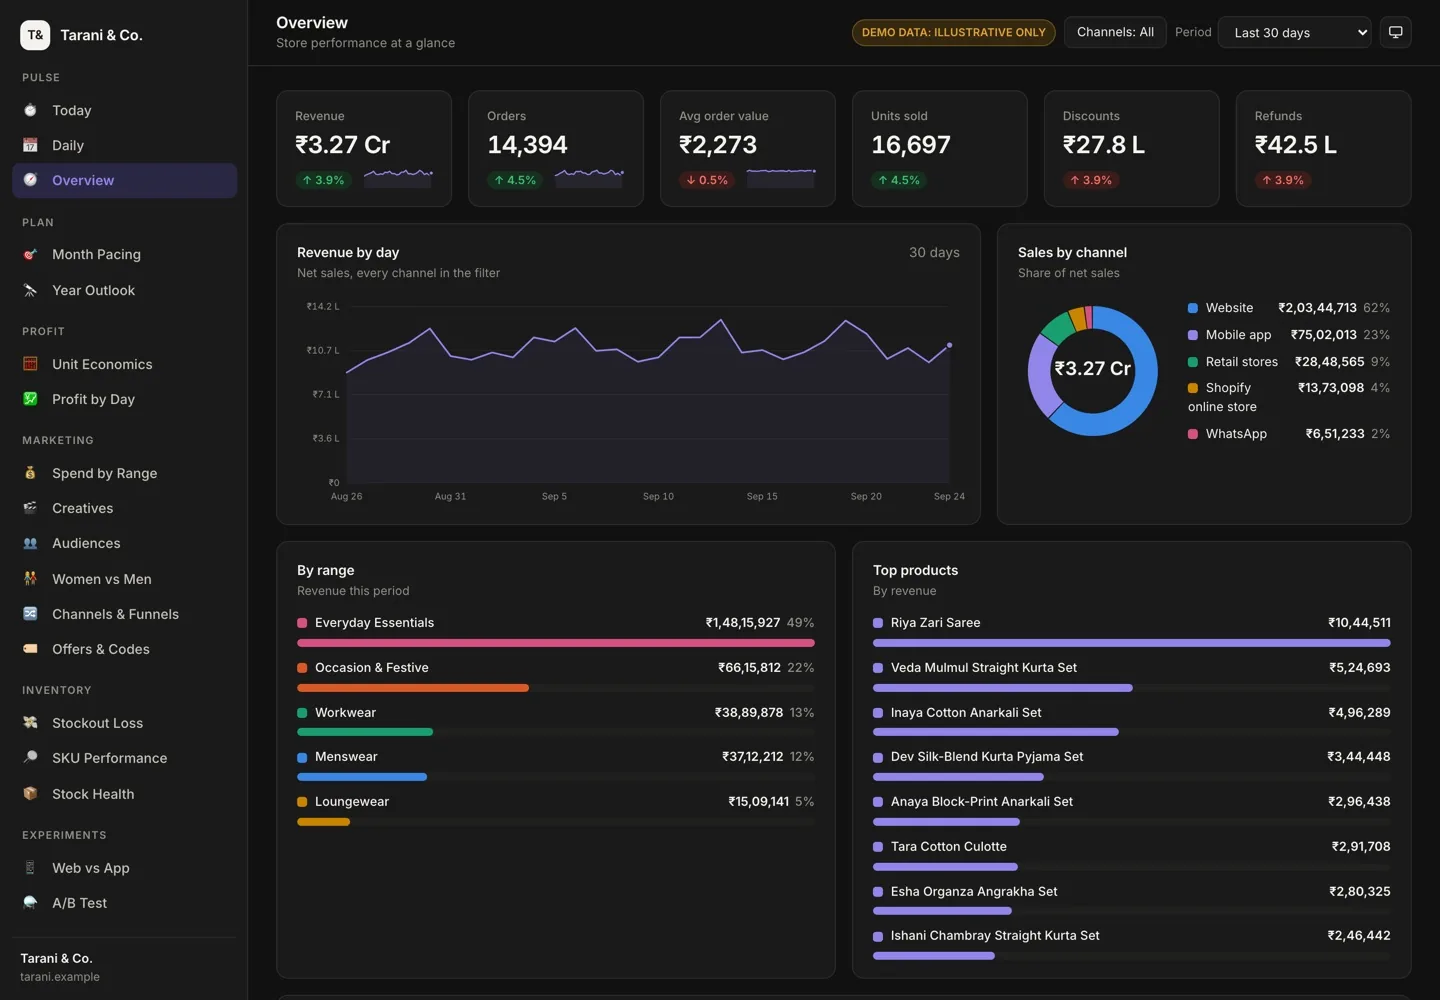
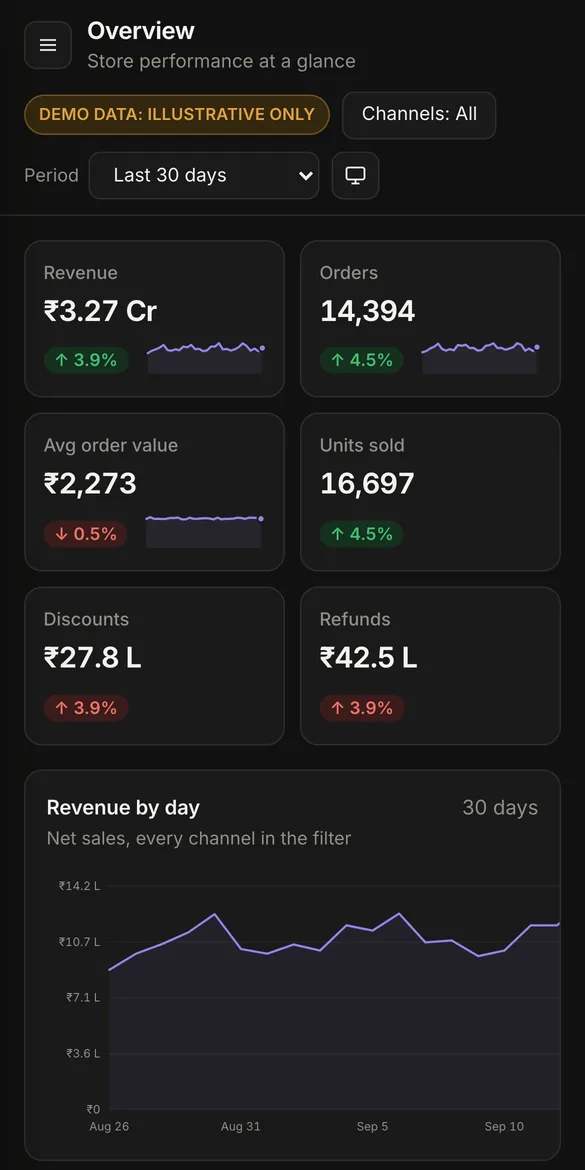
Shopify, Meta, Google, GA4 and your sheets joined into one set of numbers the whole team agrees on.
Pacing against target, margin after every cost, stock that is about to run out, spend landing on products nobody can buy.
The recurring work after the number — reports, reconciliation, reorder follow-ups, campaign checks — automated, with an owner and a record.
The dashboard
Every tab starts with the numbers that drive a decision, compared with the period before. Click through a few, then open the demo and try it yourself.
Today · Daily · Overview
Month Pacing · Year Outlook
Unit Economics · Profit by Day
Spend by Range · Creatives · Audiences · Women vs Men · Channels & Funnels · Offers & Codes
Stockout Loss · SKU Performance · Stock Health
Web vs App · A/B Test
Built for Indian brands: rupees in lakh and crore, IST, GST in the margin maths. Works on a phone too.
How it works
You tell me where your numbers disagree and what work follows them. I tell you plainly whether I can help. No deck.
Your data connected and checked, the two or three views your decisions depend on, and one workflow that runs end to end. Priced up front after the call.
I keep the connections healthy, review the numbers with your team, and add one agreed improvement at a time.
Who you will work with
I'm Dnyanal. I ran growth analytics in-house at a D2C jewellery brand: Shopify including headless, GA4 and Mixpanel, Meta and Google ads data, and the daily dashboard the team ran the business on.
That taught me which numbers drive decisions, where they quietly mislead, and what repetitive work happens after someone sees them. Flow & Logic builds that layer for other brands. You work with me directly, from the first call to the monthly review.
Book a call
The slots come straight from my Google Calendar, and the invite arrives with a Meet link. If none of them work, call or email.